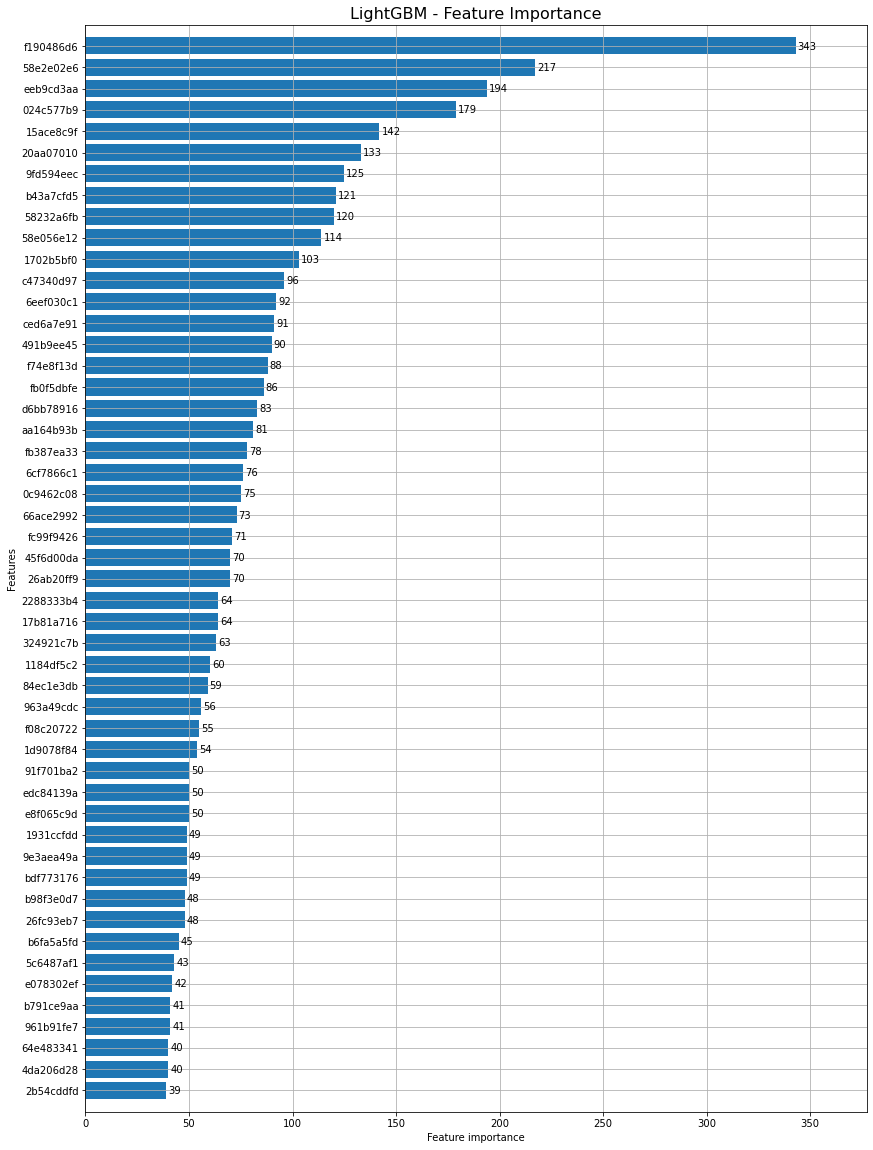
Plot Importance in LightGBM
import lightgbm as lgb
import matplotlib.pyplot as pltfig, ax = plt.subplots(figsize=(14,20))
lgb.plot_importance(model, max_num_features=50, height=0.8, ax=ax)
#ax.grid(False) Prints in grid format
plt.title("LightGBM - Feature Importance", fontsize=16)
plt.show()